|
Abstract:
The mechanical axis deviation and the normal relationship of the
joints of lower extremity has been the focus of several recent
studies. We tried to carry out standardization of the same
values in different age-groups. Sixty normal joints from 30
subjects are chosen and divided into 7 age-groups (5-10years,
11-15 years, 16-20 years, 21-30 years, 41-50 years, and 51-60
years). Congenital deformities of spine, pelvis and lower limbs
were excluded. The calculated mechanical axis deviation shows a
value of 7.54mm±4.8 (5-10yr); 11.34mm±6.9 (51-60yr); (4.1±4mm
Bhave et al). In few sporadic subjects the mechanical axis
deviated laterally in contrary to the majority of observations
(4.32 ±3.38 mm, and was 10-13mm in some subjects). However, this
needs a larger and more radiologically accurate measurement
system. Rest of the standardized values(in degrees) are
following:mLPFA:70.6±8.5(5-10yr) and
94.4±5.7(51-60yr);LPFA:76.9±8.6(5-10yr) and 98.4±5.07(51-60yr);
Femoral valgus:7.06±0.623(5-10yr) and 5.9±1.4(51-60yr);mLDFA
88.25±2.2(5-10yr) and 86.5±0.8(51-60yr);aLDFA:82.06±2.04(5-10yr)
and 81.7±1.8(51-60yr);MPTA:87.7±3.6(5-10yr) and
86±1.9(51-60yr);mLDTA:91.25±2.13(5-10yr) and
89.7±2.4(51-60yr);MNSA:138.9±6.5(5-10yr) and 125±3.3(51-60yr).
The MAD found to be different in different age-groups and its
range is more in the elderly as compared to standard values. The
few subjects showing lateral shifts of MA in relation to knee
joint center are frequent in younger age groups but also found
in different subjects sporadically. Measurement of mechanical
axis deviation and joint orientation and alignment parameters
are thus useful determining the normal range of anatomical and
mechanical variation of lower extremity. The values obtained in
the present study show tendency to increasing varus of proximal
femur and knee as age advances. The normal ranges of the values
may thus help determining surgical options in deformity
correction.
J.Orthopaedics 2009;6(3)e4
Keywords:
Axis
Deviation; frontal alignment; lower limb, Indian ethnic
population
Introduction:
The mechanical axis deviation of lower limb and the normal
relationship of the joints of lower extremity has been the
focus of several recent studies[1,2].Most of the studies mainly
included adult subjects and relevant data are also available in
various publications. In the present study we tried to carry out
standardization of the same values in different age-groups of
Indian ethnic population.
In standing position, forces on the hip joints are divided
equally. Considering each lower extremity as one-sixth body
weight, then two-thirds of the bodyweight will be above the
hips or one-third in each hip. Stabilization of the trunk in the
antero-posterior plane by ligament and muscle forces probably
increases the load.
To have a better understanding of the alignment and joint
orientation, the complex three-dimensional shapes of bones and
joints can be simplified to basic line drawings. For purpose of
reference, these line drawings should refer to either the
frontal, sagittal or transverse anatomic planes.
In different age groups these parameters change due to different
anatomical variation in different parts of hip joint, femur,
knee joint, tibiae and ankle joint. The dynamic variation has
also been found to show variation in different racial groups.
The objective of present study is to show the differences in
these parameters in different age groups. A comparative trial
was not possible as no values are available in the literature
for other age groups except adults using similar nomeclature.
The relationship to osteoarthritis of knee joint and
consequences of mono/bi/tricompartmental osteoarthritis such as
varus deformities of knee to the mechanical axis deviation is
not included in the present study as they need long-term
follow-up of individuals throughout their life.
Materials
and Methods:
After obtaining local ethical committee approval 30 healthy
subjects were chosen who volunteered to take part in the study.
Written consents were obtained from patient or their parents who
kindly agreed to allow us taking single lower limb x-ray. When
explained about minor risk involved with a single X-ray
obviously only 5 female subjects consented and took part in the
study. Sixty normal joints from randomly selected 30 subjects (
Male 25,female 5) are chosen and divided into 7 age-groups (5-10
y, 11-15 y, 16-20 y, 21-30 y, 41-50 y, 51-60 y). Congenital
deformities of spine, pelvis and lower limbs were excluded. No
sex, occupation, body-weight bias considered. Full length
standing AP x-rays taken with 300mA X ray machine(fig-1) keeping
legs slightly internally rotated and with intermalleolar
distance of 30cm (or less in children) to keep limbs parallel.
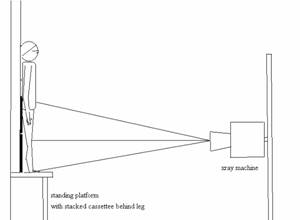
Figure-1: position of patient
We did not have the facility for telescopic x-ray machines and
used 300mA standard X-ray machines with tables. The chest stand
is use for subject placement. The problem of the obstacle
created by the table top in guarding beams of x-rays to reach
the floor was overcome by making the subject to stand on a long
stool.
The subject was made to stand bare-footed, with hip, knee in
full extension, the ankle plantigrade, patellae facing forward
with tibiae vertical and with slight internal rotation .There
was equal weight bearing on both limbs.
The tube is focused at the knee; the film-focus distance
adjusted according to the height of the patient .No grid was
used due to non-availability of long grid. Exposure was set to
75-95kv depending on distance and size of patient.30-50mA per
second setting used with individualized adjustments.
The need to adjust the collimated beam according to the height
of the patient dictated different film-focus distances for
different subjects. The resulting magnification is calculated
form the marker scale used was 10-13 %( Fig-2, 3) .Necessary
correction for magnification was done for each value obtained by
the first author (S.M).All the results are being reviewed by
senior authors.
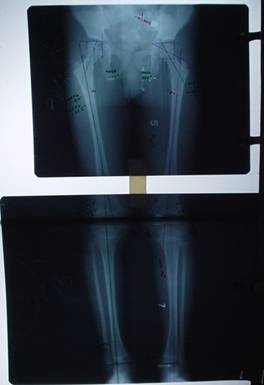
Figure-2: Full-length radiograph
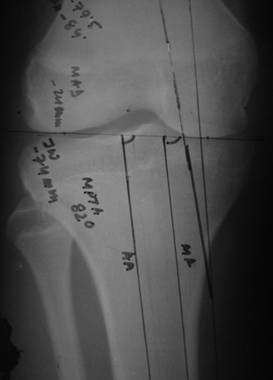
Figure-3:
Knee-joint orientation
Radiographic marker scale was used for measurements. Recent
nomenclature of joint orientation, alignment and angles adopted
from Dror Paley are as follows: aLPFA-Anatomical Lateral
Proximal Femoral Angle; mLPFAmechanical Lateral Proximal
Femoral Angle ; MNSAMedial Neck-Shaft Angle, etc.(m-mechanical,
a-anatomical, M medial, L-Lateral ,P-proximal, D-distal,
A-angle, F-Femur, T-tibia); MAD-Mechanical Axis Deviation. The
sagittal plane axis measurements were not included in the
present study group.
Results :
Along with the values for mechanical axis deviations we also
carried out measurements to work out values of different joint
orientation angles in frontal plane such as mLPFA, aLPFA,
femoral valgus, mLDFA, aLDFA, MPTA, mLDTA, MNSA.
According to available literature frontal plane joint
orientation angles measured in adults (mostly females) are
depicted in Table-2. In the present study we have measured the
same measurements in different age-groups. The individual
observations are summarized into mean and standard deviation
values in Table-1.
|
Age Group |
mLPFA
±SD |
aLPFA
±SD |
Femoral
Valgus ±SD |
mLDFA
±SD |
aLDFA
±SD |
MPTA
±SD |
mLDTA
±SD |
MNSA
±SD |
|
5-10y |
70.6±8.5 |
76.9±8.6 |
7.06±0.62 |
88.2±2.2 |
82.06±2.04 |
87.7±3.5 |
91.2±2.14 |
138.9±6.5 |
|
11-15y |
85.6±7.7 |
90.1±10.2 |
6.4±1.8 |
86.5±1.5 |
81.7±1.7 |
86.3±2.5 |
88.06±2.9 |
130.4±8.4 |
|
16-20y |
88.8±4.14 |
92.1±5.08 |
5.8±0.9 |
85.6±1.4 |
81.3±1.7 |
84.2±2.5 |
90.7±4.6 |
133.2±8.1 |
|
21-30y |
86.9±9.08 |
93.1±11.3 |
6.05±1.5 |
84.9±0.7 |
80.2±2.7 |
85.5±1.2 |
92.4±5.7 |
131.5±9.4 |
|
31-40y |
87.5±2.6 |
87.12±2.2 |
5±1.07 |
86.9±0.9 |
80.8±1.2 |
85.7±0.7 |
90.6±1.5 |
130.06±5.4 |
|
41-50y |
91.6±5.5 |
94.9±4.5 |
5.6±0.7 |
86.4±1.4 |
81.8±1.8 |
85.4±2.4 |
92.2±3.1 |
129.7±4.02 |
|
51-60y |
94.4±5.7 |
98.4±5.07 |
5.8±1.4 |
86.5±0.8 |
81.7±1.8 |
86±1.9 |
89.7±2.4 |
125±3.3 |
Table-1:
Joint orientation angles in degrees in different age groups in
present study
|
mLPFA |
89.4±4.8-Bhave;
94.6±5.5-Chao;89.2±5.2Paley |
|
mLDFA |
88.1±1.5-Bhave;
88.1±3.2-Chao
; 87.8±1.6-Paley |
|
aLDFA |
81°,range 79°-83°- Paley |
|
MPTA |
88.3±2
-Bhave;87.5±2.6-Chao
; 87.2±1.5
Paley |
|
mLDTA |
88.7±2.7
-Bhave; 87.1±3.3-Chao
; 88.6±3.8
Paley |
|
MNSA |
122±2.6
Bhave; 129 Yoshiroka ;129.7±6.2
Paley |
Table -2:
Joint orientation angles in adults available in literature
Femoral valgus is variable in normal subjects and in our study
the values show a tendency of decreasing valgus angle with
increasing age(table-2). Measurements of MAD is again variable
and adult values described in literature are 4.1±4mm(Bhave)
to 9.7±6.8mm(Paley).
Our study shows (Table-3) higher range of values in different
age groups suggesting increased tendency to varus in Indian
ethnic population.
|
|
MAD after
magnification correction ( in millimeter) ( mean ±SD) |
|
Age Group |
5-10y |
11-15y |
16-20y |
21-30y |
31-40y |
41-50y |
51-60y |
|
|
7.54± 4.8 |
1.7 ±1.2 |
10.7±7.1 |
6.5±4.5 |
9.3±2.4 |
10.8±2.4 |
11.3±6.9 |
|
Values( mean ±SD)
as % of joint
width |
15.6± 8.05 |
3.13± 2.2 |
16.58± 1.5 |
10.52±8.68 |
13.64± 3.6 |
15.3± 3.1 |
17.14± 11.03 |
Table-3:
Mechanical axis deviation values in different age-groups.
|
Age |
Joint Width (mm)(Right-R,
Left-L) |
MAD(mm) |
Percentage of joint
width |
average of the
percentage values
( mean ±SD)
6.66±5.35 |
|
15years |
60 mm( R) |
0.89 |
1.67% |
|
23years |
70(R),66(L) |
8.9, 6.23 |
14.3%,10.6% |
|
25years |
78(R) |
8.01 |
11.54% |
|
50years |
75(L) |
0.9 |
1.33% |
|
60years |
80(R),85(L) |
1.78,3.56 |
2.5%,4.7% |
|
MAD lateral to joint centre ( mean ±SD) |
4.32 ±3.38 |
|
Table-4 :
MAD lateral to knee joint centre in adolescents and adult
subjects
It has also been noted that in few subjects the mechanical axis
is actually lateral to the joint centre (Table-4). These
subjects did not have any symptoms or clinical malalignment
while recruiting them in the study. All the measurements were
repeated to minimize observer bias.
Discussion :
The joint orientation angles have been given various names by
different authors in available literature( Chao et al 1994,Cooke
et al 1987,Krackow 1984,Moreland et al 1987) (5,6,7,8).The axial
alignment parameters of the lower extremity was described using
special reference points by Hsu RWW et al( 5).Hsu described
tibial mechanical angle, femoral mechanical angle, proximal
anatomic angle of femur, distal anatomic angle of femur, overall
anatomic angle of femur, knee plateau angle etc. with respect to
horizontal. Later Paley et al standardized the nomenclature (1).
To measure knee joint orientation Cooke et al (1987, 1984)
obtained radiographs of the knee& hip after positioning the
patient in a QUESTOR frame to improve reproducibility. In 79
asymptomatic young adults, the distal femoral orientation line
measure valgus of 86±
2.1°. Paley et al described
in mLDFA to be 87.5±2.5°
as normal. In a retrospective study of 25 knees in adult
patients of different ages, the normal MAD was 9.7±6.8mm
medial (Paley et al, 1994).
Bhabe et al demonstrated MPTA of 88.3±
2°
in patient older than 60 years. Cooke et al and Moreland found
MPTA as 86.7±
2.3°
and 87.2± 1.5°
respectively.
Moreland et al (1987) reported that the ankle is slight valgus
(89.8±
2.7°).LDTA
according to Paley et al and Chao et al was 88.6±
3.8°)
and 87.1± 3.3°.Inman
measured 107 cadavers and deduced ankle joint orientation
equivalent to LDTA of 86.7± 3.2°,
with a range of 80-92°.
Our study shows more varus orientation of the proximal femur (MNSA)
in young and young adult population as compared to the available
adult data (table-1and 2).The data also suggests slightly lesser
values of mLDFA as age advances. Clearly proximal tibial varus
angle (MPTA) showed lesser values than available data suggesting
increasing proximal tibial varus tendency in our Indian ethnic
study group.
The MAD found to be different in different age-groups and its
range is more in the elderly age groups, as compared to standard
values. The few subjects showing lateral shifts of MA in
relation to knee joint center are frequent in younger age groups
but also found in different subjects sporadically with a mean
value of 4.32mm (±3.38.).In a recent study Sabharwal S et al (4)
examined 253 children from 1-18 years and found a tendency of
valgus orientation in frontal plane radiograph. The study also
showed that after 7 years of age the measurements fall in the
adult reference range.
In our study on the other hand despite looking at 60 unaffected
lower limbs noticed valgus orientation of mechanical axis in
five different patients from 15-60 years of age. The difference
in values was found despite the fact that our study group
contains more males than females, bearing the fact in mind that
prevalence of osteoarthritis of knee in females is higher than
males. It is debatable whether the findings can be extrapolated
in a larger population group. Certainly similar examinations in
larger study group may provide a better estimate of the
orientation in Indian ethnic population to support or refute the
abovementioned finding.
Measurement of mechanical axis deviation and joint orientation
and alignment parameters are thus useful determining the normal
range of anatomical and mechanical variation of lower extremity.
The values obtained in the present study show tendency to
increasing varus of proximal femur and knee as age advances
which may be related to early osteoarthritic changes in knee of
the Indian population. The normal ranges of the values may thus
help in further studies of measurement of deformity in Indian
ethnic population as a reference standard which is so far
unavailable in published English literature. It is also
difficult to perform this type of study in an area with limited
resources. Moreover, the data provided might help in planning
deformity correction, navigation surgeries, and interpretation
of CT scannograms in future.
Reference :
-
Analysis of limb alignment in the pathogenesis of
osteoarthritis: a comparison of Saudi Arabian and Canadian
cases.Cooke TD, Harrison L, Khan B, Scudamore A, Chaudhary
MA.Rheumatol Int. 2002 Aug;22(4):160-4. Epub 2002 Jul 3.
-
Biomechanics of malalignment.Chao EY, Neluheni EV, Hsu RW,
Paley D.Orthop Clin North Am. 1994 Jul;25(3):379-86.
-
Normal axial alignment of the lower extremity and load-bearing
distribution at the knee. Hsu RW, Himeno S, Coventry MB, Chao
EY. 1: Clin Orthop Relat Res. 1990 Jun;(255):215-27
-
Lower limb alignment in children: reference values based on a
full-length standing radiograph. Sabharwal S, Zhao C, Edgar M.
J Pediatr Orthop. 2008 Oct-Nov;28(7):740-6.
-
Chao EY, Neluheni EV, Hsu RW, Paley D .Biomechanics of
malalignment..Orthop Clin North Am. 1994 Jul;25(3):379-86.
-
Yoshioka Y, Siu D, Cooke TD.The anatomy and functional axes of
the femur.J Bone Joint Surg Am. 1987 Jul;69(6):873-80.
-
Krackow KA. Total knee arthroplasty: technical planning and
surgical aspects. Instr Course Lect. 1986;35:272-82.
-
Moreland JR, Bassett LW, Hanker GJ.Radiographic
analysis of the axial alignment of the lower extremity.J Bone
Joint Surg Am. 1987 Jun;69(5):745-9.
|