|
Abstract:
Introduction
Ultrasonography and roentgenography are basic imaging
modalities to detect developmental dysplasia of the hip (DDH).
Accepted normal value for ultrasonographically measured alpha
angle according to Grafs’ technique is 60 degrees or more and
accepted normal value for an acetabular index measured on a
plane roentgenogram is 30 degrees or less, in a mature hip. The
aim of this study is to point out the negative correlation
between the ultrasonographically measured alpha angle and the
radiologically measured acetabular index.
Methods As these images are put over each other in a
vertical manner; a right angled triangle is formed when the
deepest point of the acetabulum is the intersection point. We
name this triangle; ‘DDH triangle’.
Results When the alpha angle increases, the opposite leg of
the triangle which corresponds to the acetabular depth increases
and the other angle of the triangle; acetabular index
decreases.
Conclusion The sum of alpha and acetabular index degree is
usually 90 degrees and the right angle formed by the
Hilgenreiners line and the straight line tangent to the ilium is
90 degrees. These three angles form a triangle, which the sum of
inner angles of a triangle is 180 degrees.
J.Orthopaedics
2009;6(2)e2
Keywords:
Triangle;
Alpha angle; Acetabular index; Developmental Dysplasia of the
Hip
Introduction:
Various
techniques have been proposed for the imaging of the infant hip.
Ultrasonography is a well accepted imaging modality in the
detection of developmental dysplasia of the hip (DDH) in the
neonatal period. When assessment of the bony acetabulum is
concerned, radiography of the pelvis is beneficial (1).
The
ultrasonographic assessment of acetabular development may be
done using either the alpha angle method of Graf (2) or d/D
ratio of Harcke (3). Ultrasonography is an effective method, if
applied properly; the position of the patient, the position of
the probe and signing the landmarks for measuring the angles are
important factors for a reliable result (4). The high level of
agreement between different observers is encouraging (5).
In
the early times of life, when the femoral heads are composed
entirely of cartilage, radiography is of limited value unless a
dislocation is present. By 4 to 6 months of age, radiographs
become more reliable. Radiography of the pelvis should be
obtained with hips in neutral position. Dislocation or
subluxation of the femoral head can be recognized by evaluating
the relationship of the ossific nucleus of the femoral head and
metaphysis to the acetabulum. The radiographic evaluation
consists predominantly of a visual assessment; however,
measurement of the acetabular index is an objective parameter
that may be used in the diagnosis and follow-up of patients with
DDH (6).
There
is a negative correlation between the alpha angle and the
acetabular index degree. It looks like the relation between the
inner angles of a right angled triangle. We aimed to examine the
relation between the alpha angle and the acetabular index by
making a class with a triangle. This is an expert opinion study
based on a retrospective study.
Materials
and Methods:
Between
January 2008 and July 2008, 30 hips of 15 patients, who had
pelvis roentgenography when they appealed to our clinic were
evaluated ultrasonographically. These roentgenographies were
taken in some other clinics which don’t have ultrasonography
device. Mean age of the patients was 2.53 (range 1 to 6) months.
We use ultrasonography as an imaging tool up to 4 months age in
our daily practice. Two, 6 months aged patients having pelvis
roentgenogram, who upgrade the mean age, were also included to
the study. Ultrasonography was applied to the patients using the
Graf technique with the help of a 7.5 MHz, 80 mm linear
transducer (Hitachi EUB-405, Hitachi Medical Co., Sendai,
Japan).
According
to Graf’s technique, the ultrasound picture is taken laterally
in a coronal plane and the coronal plane should pass through the
center of the hip joint. The center of the hip joint is marked
by the lower limb of the os ilium in the acetabulum. If the
picture is taken in the correct plane, not directed dorsally or
ventrally, some reference points must be identified. Deepest
point of the acetabulum, inferior osseous edge of the ilium, and
the labrum are seen. To classify certain hip types, Graf has
introduced an angle of the bony acetabular roof ‘α’
(alpha) and another for the cartilaginous acetabular roof ‘β’
(beta) (7).
For
measuring the alpha and the beta angle, a coronal image of the
hip is obtained, and three lines are constructed: base line
(drawn parallel to the ossified lateral wall of the ilium),
cartilage roof line (drawn from the labrum to the osseous edge
of the ilium where concavity of the acetabulum turns to
convexity) and the bony roof line (drawn from the deepest point
of the acetabulum to the osseous edge of the ilium) (2). Two
angles are formed. The alpha angle is formed by the intersection
of the base line and the bony roof line (Figure 1). Alpha angle
reflects osseous coverage of the femoral head by the acetabulum,
the greater the obliquity of the acetabulum roof the smaller the
degree of dislocation. Normal value for the alpha angle is 60
degrees. The beta angle is formed by the intersection of the
base line and the cartilage roof line. A beta angle of more than
77 degrees indicates eversion of the labrum and subluxation of
the hip (8).
Figure
1) Alpha angle.
Some
of our patients who are younger than 6 months, had plane
roentgenograms when they appealed to our clinic. Thirty hips of
these 15 roentgenograms, thought to be in good quality having a
standard measurement plane to carry out a reproducible
measurement, were regarded as acceptable and were included to
the study.
On
a pelvic radiograph various lines may be drawn to help evaluate
acetabular maturity and femoral head position. Hilgenreiners
line is a horizontal line connecting the superior margins of the
triradiate cartilages. Perkins line is a line vertical to
Hilgenreiners line drawn through the most superolateral margin
of the ossified acetabulum. Acetabular index is the angle
between Hilgenreiners line and a line drawn from the most
superolateral margin of the ossified acetabulum to the
superolateral margin of the triradiate cartilage. DDH is
associated with an increased acetabular index angle (9). Normal
value for the acetabular index is 30 degrees.
In
order to examine whether there is correlation between the alpha
angles and the acetabular index degrees, the ultrasonographic
images were put over the pelvis AP roentgenograms as they are in
vertical planes to each other and the intersection point is the
deepest point of the acetabulum (Figure 2a). The intersection of
the radiological Hilgenreiners line and the ultrasonographical
base line is 90 degrees. A right angled triangle is formed
(Figure 2b). Schematic demonstration of this triangle is in
Figure 2c. The sum of normal value of alpha angle, normal value
of acetabular index and the right angle makes totally 180
degrees, as the total of inner angles of a triangle is always
180 degrees.
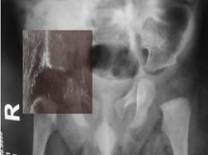
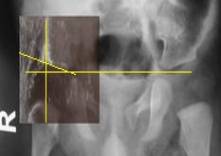
Figure
2a: USG image put over the roentgenogram vertically, 2b:
DDH triangle, 2c: Schematic presentation of DDH triangle.
The
measurements were done by two assistant professors of
Orthopaedics and Traumatology who are interested in pediatric
orthopaedics. Measurements were analyzed statistically using a
PC program (SPSS for Windows, version 13.0, SPSS Inc., Chicago,
Illinois, USA). Correlation between acetabular index and alpha
angle was analyzed via calculation of the Pearson correlation
coefficient.
Results
:
Mean
acetabular index was 23.67° for the right hips and 24.67° for
the left hips. Right alpha angle and right acetabular index
Pearson Correlation Coefficient was -0.343, left alpha angle and
left acetabular index Pearson Correlation Coefficient was
-0.753. The negative Pearson correlation shows that; when one of
the parameter increases, the other parameter decreases.
We
realized that at 22 of the 30 hips; the sum of the alpha angle
and the acetabular index for the same hips makes 90 degrees. In
5 hips the sum was between 90-94 degrees. In 3 hips the sum was
between 86-90 degrees. The total is usually around 90 degrees.
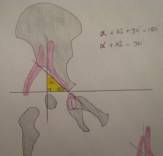
If
the alpha angle increases, acetabular index degree decreases.
This shows the maturity of the hip. Geometrically, if the
opposite leg of an angle is long, the angle is big in a triangle
(Figure 3). If the alpha angle is big, it is positively
correlated with the opposite leg which shows the depth of the
acetabulum(d).That means that if the alpha angle increases, it
causes an increase in the depth of the acetabulum. The
acetabular index degree decreases as the alpha angle increases
at the same time.
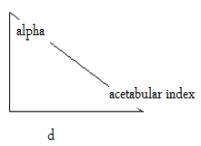 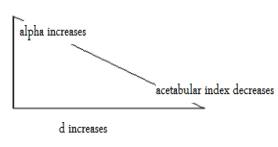
Figure
3: DDH triangle
By
using the ultrasonographically measured alpha angle and
acetabular index on plane radiographs which both show the bony
acetabular depth, we realized that the sum of these angles
usually make 90 degrees. When the ultrasonographic image is put
over the pelvis roentgenography in a vertical manner; there
occurs a triangle which we name ‘DDH triangle’. It is a
right angled triangle formed by the intersection of the lines
showing the acetabular index, alpha angle and a right angle made
by the intersection of the Hilgenreiners line and
ultrasonographic straight lateral margin of the ilium(like
Perkins line).
Discussion
:
Ultrasonography
helps to confirm the diagnosis and to identify more subtle forms
of DDH (10). Roentgenography is another imaging modality in the
diagnosis and follow-up of DDH. As the maturity goes on, the
depth of the acetabulum is bigger when the alpha angle increases
and the acetabular index decreases.
In
a study by Morin et al. (1), one hundred and fifty infant hips
were studied using simultaneous ultrasonography and radiography.
The reliability of measurement was found to be similar for alpha
angle and d/D ratio. For measuring the d/D ratio, two straight
lines parallel to the iliac line are drawn, one tangent to the
lateral aspect of the femoral head and the other tangent to the
deepest point of the acetabulum. The ratio of d (depth of the
acetabulum) to D (diameter of the femoral head) multiplied by
one hundred gave the index of acetabular depth (1).
However,
the acetabular index correlated much better with the d/D ratio
than with the alpha angle. The study showed that d/D ratio
decreased as the acetabular index increased and d/D ratio
decreased as the alpha angle decreased. We realized the negative
correlation between the alpha angle and the acetabular index in
our study.
Gunay
et al. (11) examined 1037 infants’ 2034 hips for detecting DDH.
They measured the femoral head coverage, as the ratio of the
acetabular width to the maximal femoral head diameter. They
found that femoral head coverage is positively correlated with
alpha angle.
In
another study by Morin et al. (3), they examined 171 infants.
The authors used ultrasonography to calculate a parameter which
they called femoral head coverage, and this was compared to the
acetabular indices obtained via anteroposterior radiographs of
the pelvis in the same patients. All hips having femoral head
coverage greater than 58% had normal acetabular indices, while
all hips with coverage less than 33% had abnormal acetabular
indices for their age group. The authors point out that although
these threshold values eliminate the possibility of false
negatives and thus provide criteria having 100% specificity; the
sensitivity is low due to the large region between the two
threshold values where normal and abnormal hips both occur. For
example, of the 236 hips that had normal acetabular indices,
only 107 were above the threshold value of 58% femoral head
coverage, which gives a specificity of 45%.
In
another study by Melzer (12), sonomorphologic and
radiomorphologic examinations were performed on 14 hip joints of
children between 36 weeks and 12.5 months of age. A discrepancy
between the X-ray and ultrasound image is always found when the
contour line of the acetabulum does not correspond to the
mid-portion but rather to the ventral or dorsal section of the
acetabulum in correct projection of the X-ray image. If the
radiologic contour line of the acetabulum is determined by the
mid-portion of the acetabulum, the angle of the acetabulum in
the X-ray image and the alpha angle in the ultrasound image
always add up to 90 degrees (12). We also realized that
the total of alpha angle, the acetabular index and a right angle
(formed by the Hilgenreiners line and the straight line tangent
to the ilium) makes 180 degrees as the sum of the inner angles
of a triangle.
As
we described in our triangle theorem; when the depth of the
acetabulum is deep (d), alpha angle is big, acetabular index
degree is small, femoral head coverage and d/D ratio is big. In
a triangle, length of a leg of a triangle is positively
correlated with the opposite angle. If the alpha angle is big,
acetabulum is deep, the other angle (acetabular index) is small
and the hip is more mature.
The
relationship between the ultrasonographic alpha angle and the
acetabular index in this study represents a mathematical
computation. It initially seems complex but in reality
represents the normal changes between normal and abnormal
acetabular development. In clinical practice, when a clinician
sees an ultrasonographic alpha angle of a patient, he may have
knowledge about the acetabular index and femoral head coverage.
Reference :
-
Morin
C, Zouaoui S, Delvalle-Fayada A, Delforge PM, Leclet H.
Ultrasound assessment of the acetabulum in the infant hip. Acta
Orthopaedica Belgica. 1999; 65(3):261-265.
-
Graf
R. Diagnosis
and Management of Infant Hip Dysplasia. Second Edition,
Springer. 2007
-
Morin
C, Harcke T, MacEwen GD. The infant hip: Real time US
assessment of acetabular development. Radiology.
1986; 157:673-677.
-
Graf
R. New possibilities for diagnosis of congenital hip joint
dislocation by ultrasonography. J.Pediatr.
Orthop. 1983; 3:354-359.
-
Graf
R. Gelişimsel kalça displazisinde ultrasonografi.
(Article in Turkish) Acta
Orthop Traumatolo Turc. 2007; 41 Suppl 1:6-13.
-
Kay
RM, Watts HG, Dorey FJ. Variability in the assessment of
acetabular index. J.
Pediatr Orthop. 1997; 17(2):170-173.
-
Tönnis
D, Storch K, Ulbrich H. Results of newborn screening for cdh
with and without sonography and correlation of risk factors.
J Pediatr
Orthop. 1990; 10:145-152.
-
Wientroub
S, Grill F. Current concepts review. Ultrasonography in
developmental dysplasia of the hip. J
Bone Joint Surg Am. 2000; 82-A;1004-1018.
-
Spatz
DK, Reiger M, Klaumann M, et al. Measurement of acetabular
index intraobserver and interobserver variation. J.
Pediatr Orthop. 1997; 17(2):174-175.
-
Weinstein
SL, Mubarak SJ, Wenger DR. Developmental hip dysplasia and
dislocation: part 1. J
Bone Joint Surg Am. 2003; 85:1824-1832.
-
Gunay
C, Atalar H, Dogruel H, Yavuz OY. Correlation of femoral
head coverage and Graf α angle in infants being
screened for developmental dysplasia of the hip. International
Orthopaedics. 2008; DOI 10. 1007/s00264-008-0570-7
-
Melzer
C. Correlation between ultrasound and X-ray imaging. Orthopade.
1997; 26:43-48.
|